Research & project showcases

01 · Time-series machine learning

Predicting Bitcoin Price Direction

A three-day Bitcoin-direction study built around chronological validation, feature engineering, and uncertainty-aware model comparison.

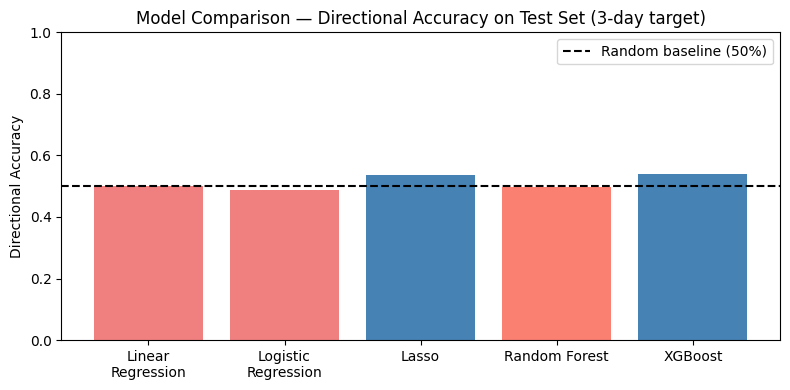
Model comparison chart for Bitcoin directional accuracy
Role

Independent quantitative research - data preparation, feature engineering, model comparison, validation, and reporting.

Context

Financial time series are autocorrelated, so random train/test splits can overstate predictive performance. The workflow preserves time order throughout evaluation.

Tools

Python · XGBoost · scikit-learn · TimeSeriesSplit · pandas · Yahoo Finance

Project overview

The project tests whether market and on-chain signals can improve three-day Bitcoin direction classification without leaking future information into model selection.


Research question

Can engineered price and on-chain signals produce directional accuracy meaningfully above a 50% baseline on unseen Bitcoin observations?

Workflow

  1. 01Merge Yahoo Finance daily BTC history with CoinMetrics Community API MVRV data.
  2. 02Construct momentum, trend, volatility, oscillator, lag, and valuation features, then define a three-day forward-return target.
  3. 03Remove near-flat forward returns using the documented ±1% filter and retain a chronological 80/20 split.
  4. 04Compare linear, logistic, Lasso, random-forest, and XGBoost models with TimeSeriesSplit validation and bootstrap intervals.
02

Data & methodology

Data sources

  • Yahoo Finance daily BTC market history
  • CoinMetrics Community API MVRV series
  • 4,062 daily observations before target filtering

Methods

  • 38 engineered market and on-chain features
  • Chronological 80/20 split
  • TimeSeriesSplit cross-validation
  • 1,000-resample bootstrap confidence intervals
Evidence boundary
InputPreparationAnalysisOutput

Charts and methods are drawn from the local notebook and research report; no local file path is exposed publicly.

03

Key visuals

Directional accuracy comparison across five Bitcoin models
Test-set directional accuracy compared with the 50% random baseline.
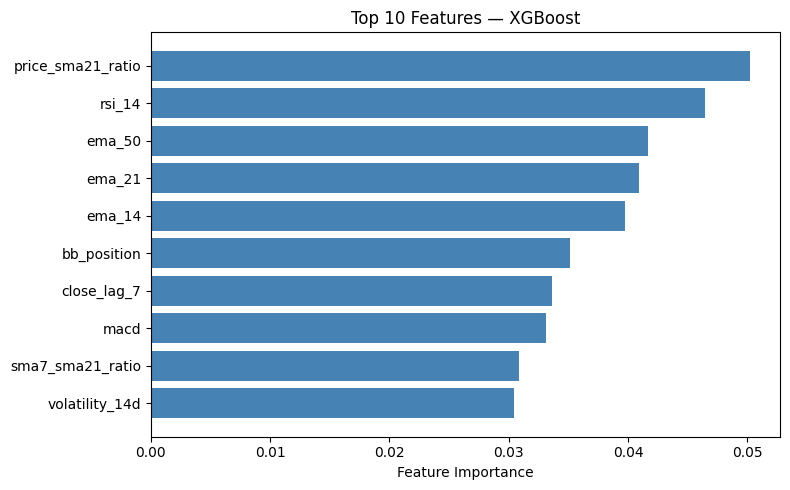
Top ten XGBoost feature-importance chart
The notebook ranks price and technical signals by XGBoost feature importance.
04

Selected code

python

Chronological Lasso validation

tscv = TimeSeriesSplit(n_splits=5)

cv_mse = [
  np.mean([
    mean_squared_error(
      y_train[val],
      Lasso(alpha=l, max_iter=10000)
        .fit(X_lasso_train_scaled[tr], y_train[tr])
        .predict(X_lasso_train_scaled[val])
    )
    for tr, val in tscv.split(X_lasso_train_scaled)
  ])
  for l in lambdas
]

The notebook uses expanding chronological folds rather than shuffling observations, reducing look-ahead bias during Lasso tuning.

Results & conclusion

Key outputs

  • Notebook model-comparison charts
  • XGBoost feature-importance chart
  • Lasso cross-validation and coefficient-path charts
  • Executive research report

Documented findings

  • 3,178 observations remained after the near-flat-return filter.
  • XGBoost reached 53.93% directional test accuracy with a reported 95% bootstrap interval of [50.31%, 57.70%].

Conclusion

The documented results support a modest exploratory directional signal, but not a production trading claim.

Decision relevance

  • Chronological validation makes the estimate more credible than a random split for this time-series setting.
  • The close-to-baseline accuracy leaves execution costs, regime shifts, and robustness as material open questions.

Limitations

  • Directional accuracy alone does not establish tradability or net returns after costs.
  • The selected data period and ±1% filter materially shape the evaluation set.
  • Exploratory research only; not investment advice.