Selected work
02 · Financial-analysis automation
SEC Financial Report Agent
Turns a public-company ticker into a source-linked, annual financial-analysis dashboard and report.
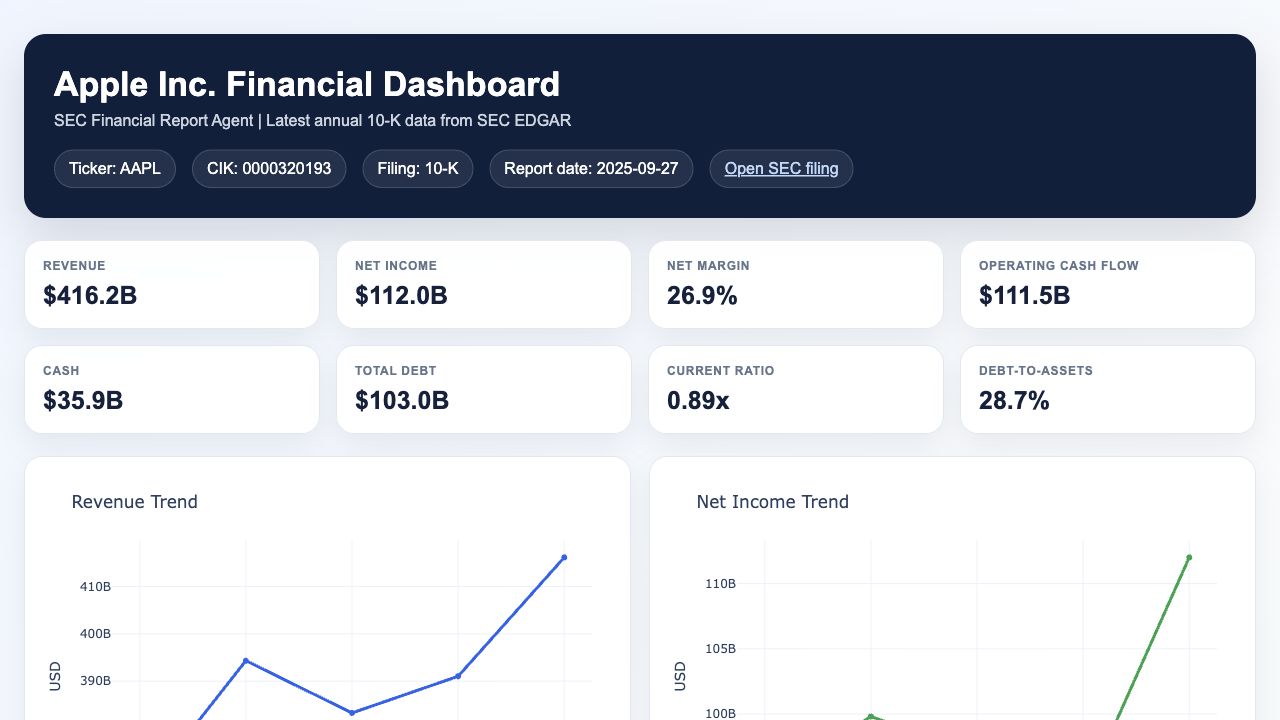 Project output · public SEC data
Executive summary
A Python and Streamlit MVP that automates the repetitive first pass of annual financial analysis: finding filings, normalizing XBRL facts, calculating metrics, generating visuals, and preparing analyst-style commentary.
Problem
Financial analysis often starts with repeated manual work across filing discovery, XBRL reconciliation, metric calculation, charting, and commentary drafting.
Approach
- 01Map tickers to CIKs and locate the latest annual 10-K through SEC endpoints.
- 02Extract four to five years of annual US-GAAP facts with fallback tags for common reporting differences.
- 03Calculate growth, profitability, leverage, liquidity, and cash-flow measures before rendering interactive charts.
- 04Provide an optional OpenAI commentary path with a rule-based fallback when no API key is configured.
02
Data & methodology
Data sources
- SEC ticker-to-CIK mapping
- SEC submissions API
- SEC company facts / XBRL API
Methods
- XBRL tag mapping with fallbacks
- Annual metric normalization
- Ratio and free-cash-flow calculations
- Five interactive financial charts
Workflow
Input→Collection→Analysis→Output
The sample visual uses public Apple 10-K data from the project output; no client data is shown.
Outputs & findings
Key outputs
- Streamlit dashboard
- Self-contained HTML report
- Annual metrics CSV
- Source filing link
What the work demonstrates
- Produces a repeatable first-pass report from a ticker while preserving source links.
- The included Apple sample demonstrates the dashboard framing and metric coverage.
Limitations
- Annual 10-K analysis only; it does not support 10-Qs.
- Generic metrics are less suitable for banks, insurers, REITs, and other specialized businesses.
- XBRL tag availability varies by company; unavailable fields remain unavailable rather than invented.